What is Technical Analysis?
The framework through which traders evaluate price movement is known as technical analysis. A person may identify present trading circumstances and prospective price movement by looking at prior price movements. The fact that all current market information is theoretically represented in the price is the most compelling argument for utilizing technical analysis
Technical analysis examines the price action's rhythm, flow, and trends. Have you ever heard the saying, "History tends to repeat itself ?" If a given price has previously served as a key support or resistance level, forex traders will keep an eye out for it and base their trades on it.
There are multiple chart patterns based on which you can identify the trend of the trading pairs.
Double Top
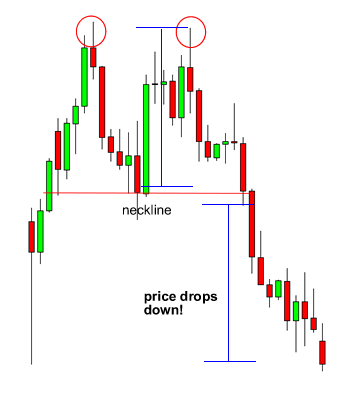
A double top is a reversal pattern that is formed after there is an extended move up.
Double Bottom
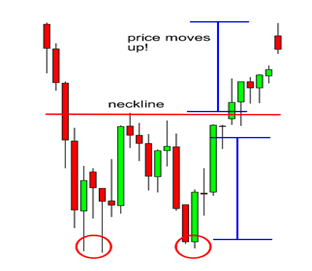
The double bottom is also a trend reversal formation, but this time we are looking to go long instead of short.
There are multiple chart patterns based on which you can identify the trend of the trading pairs.
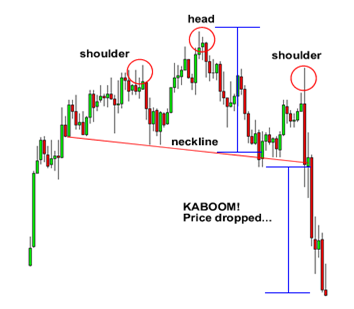
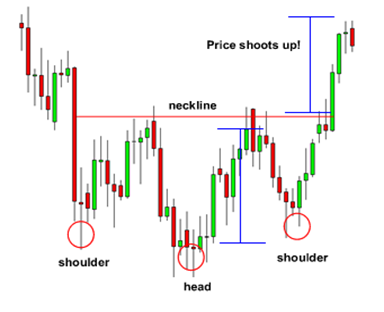
The head and shoulders chart pattern are a reversal pattern and most often seen in uptrends. It is formed by a peak (shoulder), followed by a higher peak (head), and then another lower peak (shoulder).
Inverse head and shoulders on the other hand, A valley is formed (shoulder), followed by an even lower valley (head), and then another higher valley (shoulder). Have look at the chart below:
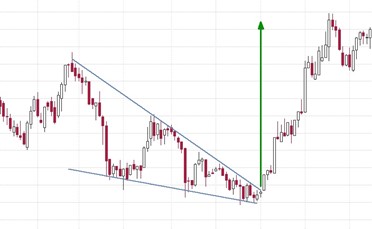
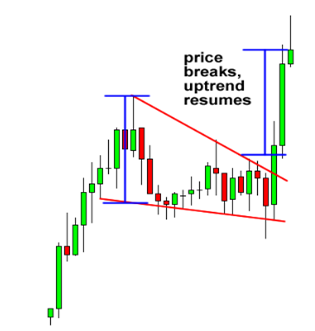
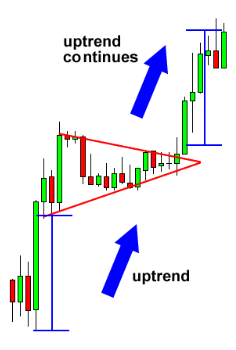
Two trend lines converge in a Wedge chart pattern. This indicates that the size of price fluctuation inside the Wedge pattern is shrinking. Wedges are a hint that the present trend is coming to a halt.
When you see this pattern, it means that forex traders are still debating where the pair should go next. A Falling Wedge is a bullish chart pattern with downward sloping lines that occurs in an upward trend.
The falling wedge serves as a reversal signal. After a downtrend, the price made lower highs and lower lows.
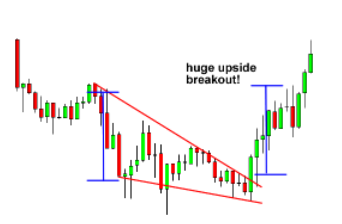
The formation of a falling wedge during an upswing typically indicates that the trend will restart later.
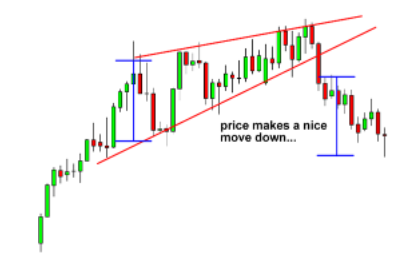
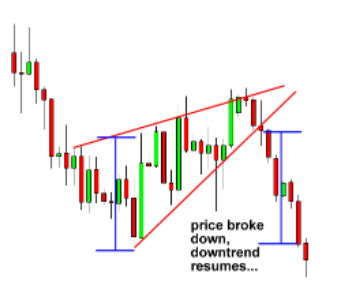
A Rising Wedge is a bearish chart pattern with upward sloping lines that appears in a declining trend. It's generally a bearish reversal pattern if the rising wedge appears after an upswing.
If it occurs during a downturn, it may indicate that the decline will continue.
The formation of a falling wedge during an upswing typically indicates that the trend will restart later.
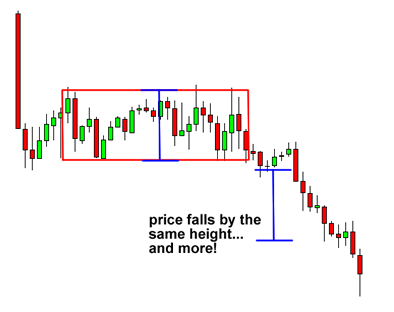
When the price is bordered by parallel support and resistance levels, a rectangle is produced on the chart.
A rectangle represents a moment of consolidation or hesitation between buyers and sellers, as they trade punches but neither has the upper hand. Before breaking out the price will "test" the support and resistance levels multiple times.
The price may then move in the direction of the breakout, whether to the upside or to the downside.
During a decline, when the price consolidates for a period, it forms a bearish rectangle.
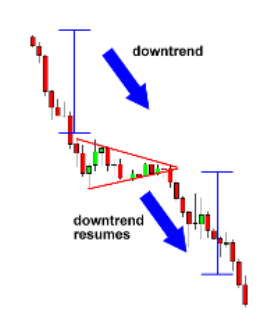
During a sharp, nearly vertical downturn, a bearish pennant form. Some sellers close their positions after the steep decline in price, while others opt to join the trend, causing the price to stabilize for a time.
The price halted after an increase to consolidate for a while. Can you predict where the price will go next?
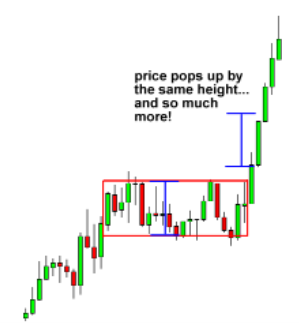
Bullish pennants, as the name implies, indicate that bulls are preparing to roar once more. This suggests that after that small time of stability, when bulls have gathered enough energy to push the price higher, the steep rise in price will restart.
SMA (Simple Moving Average)
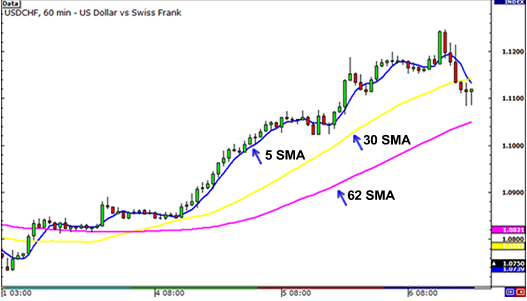
The simplest form of moving average is the simple moving average (SMA).
A simple moving average is produced by combining the closing prices of the previous "X" period and then dividing that amount by X.
If you wanted to draw a 5-period simple moving average on a 1-hour chart, sum up the closing prices for the previous 5 hours and divide by 5.
EMA (Exponential Moving Average)
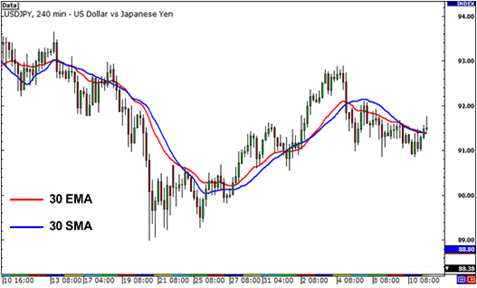
The most recent periods are given more weight by exponential moving averages (EMA). The exponential moving average puts a greater emphasis on recent events.p>
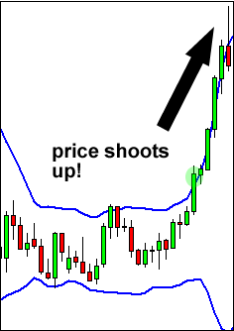
Bollinger bands
Bollinger Bands are usually shown as three parallel lines
- A band on the top
- A line in the center
- A lower-level band
The indicator's main line is a simple moving average (SMA). Most charting applications default to a 20-period moving average, which is adequate for most traders, but after you've mastered Bollinger Bands, you may experiment with alternative moving average lengths.
This is how a Bollinger Squeeze works in practice. The goal of this technique is for you to catch a move as soon as feasible. These kinds of setups don't happen every day, but if you look at a 15-minute chart, you can find them a few times a week.
It stands for moving average convergence divergence.
Bollinger Bands are usually shown as three parallel lines
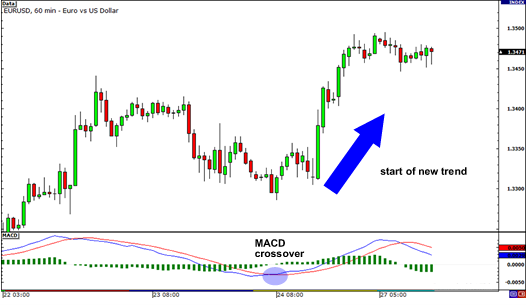
This technical indicator is a technique for identifying moving averages that indicate a new trend, whether bullish or negative. The forex market is worldwide, so trading is pretty much continuous as long as there's a market open somewhere in the world.
The cost of a transaction is typically built into the price in the forex market in the form of the spread.
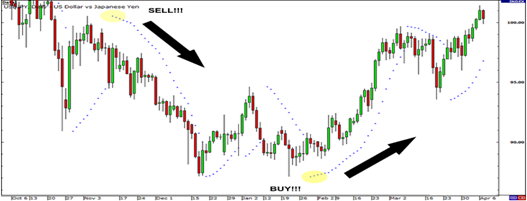
After all, what good is a well-timed entry if you don't depart on time? The parabolic SAR is one signal that can assist us detect when a trend is about to terminate (Stop and Reversal). Basically, it's a BUY indication when the dots are below the candles. It's a SELL indicator when the dots are above the candles.
Another technical indicator that traders use to determine where a trend is likely to terminate is the Stochastic oscillator. Prices will remain equal to or above the prior closing price during an upswing.
Prices will most likely remain equal to or below the prior closing price during a downturn. To anticipate the continuance of the present direction trend, the Stochastic oscillator utilizes a scale to evaluate the degree of difference between prices from one closing period to the next.
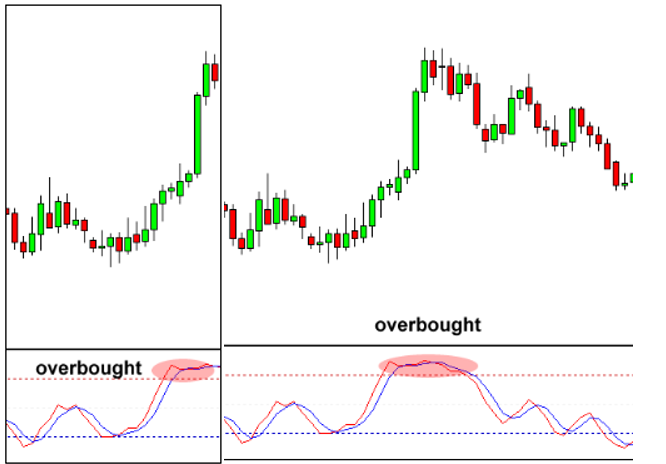
In the same way that the MACD lines are quicker than the other, the two lines are comparable. The market is overbought when the Stochastic lines are over 80 (the red dotted line in the chart above). When the Stochastic lines fall below 20 (the blue dotted line), the market is likely to be oversold.
When the market is oversold, we purchase, and when the market is likely overbought, we sell.
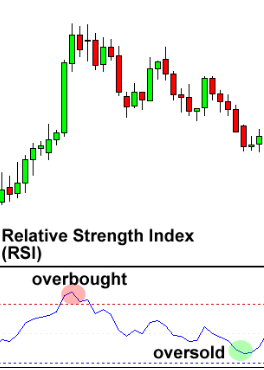
The RSI is like the Stochastic in that it detects overbought and oversold market circumstances. It also has a 0 to 100 scale. Readings of 30 or lower usually imply oversold market conditions and a greater likelihood of price strengthening (going up). Overbought circumstances and an increased risk of price weakness are indicated by readings of 70 or above (going down).
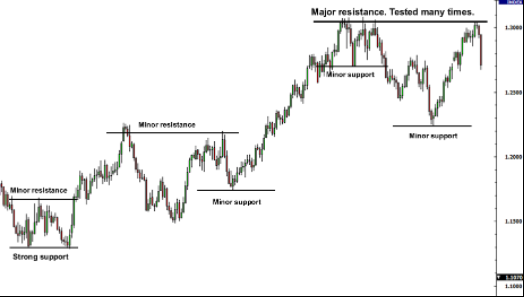
One of the most often utilized trading ideas is "support and resistance." Surprisingly, everyone appears to have their own opinion on how support and opposition should be measured. Let's start with the fundamentals.
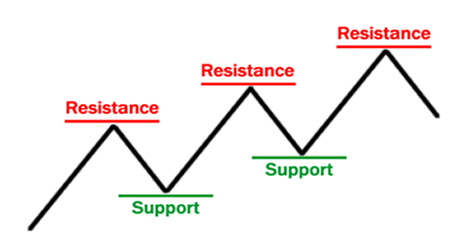
When the price goes through resistance, it has the ability to turn into support. The stronger a level of resistance or support is, the more price challenges it without breaking it. The intensity of the follow-through moves when a support or resistance level breaks is determined by how strong the broken support or resistance had been holding.
In forex trading, trend lines are arguably the most used type of technical analysis. They're also possibly one of the most underused. They can be as accurate as any other approach if drawn correctly Unfortunately, the majority of forex traders do not draw them correctly or attempt to make the line match the market rather than the other way around.
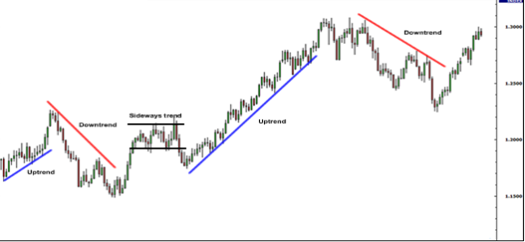
An uptrend line is formed along the bottom of plainly recognized support regions in its most basic form (valleys). A rising trend line is what this is called. The trend line is formed around the top of plainly recognized resistance points in a decline (peaks). A declining trend line is what this is called.